Global GDP Impact on Worldwide IC Market Growth Forecast to Rise

发布时间:2018-08-01 00:00
作者:Ameya360
来源:IC Insights
阅读量:857

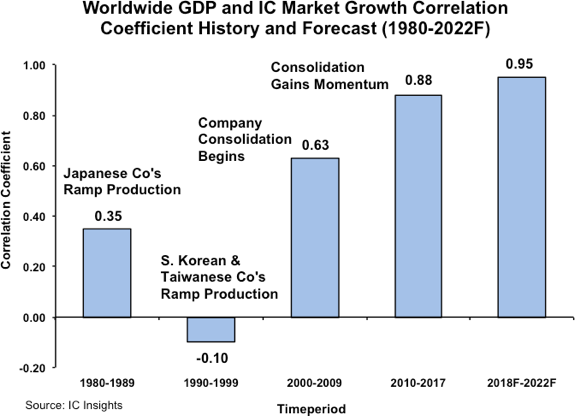
In its recently released Mid-Year Update to The McClean Report 2018, IC Insights forecasts that the 2018-2022 global GDP and IC market correlation coefficient will reach 0.95, up from 0.88 in the 2010-2017 timeperiod.  IC Insights depicts the increasingly close correlation between worldwide GDP growth and IC market growth through 2017, as well as its forecast through 2022, in Figure 1.

As shown, over the 2010-2017 timeframe, the correlation coefficient between worldwide GDP growth and IC market growth was 0.88, a strong figure given that a perfect correlation is 1.0.  In the three decades previous to this timeperiod, the correlation coefficient ranged from a relatively weak 0.63 in the early 2000s to a negative correlation (i.e., essentially no correlation) of -0.10 in the 1990s.

IC Insights believes that the increasing number of mergers and acquisitions, leading to fewer major IC manufacturers and suppliers, is one of major changes in the supply base that illustrate the maturing of the industry that is helping foster a closer correlation between worldwide GDP growth and IC market growth.  Other factors include the strong movement to the fab-lite business model and a declining capex as a percent of sales ratio, all trends that are indicative of dramatic changes to the semiconductor industry that are likely to lead to less volatile market cycles over the long term.

In 2017, IC industry growth was greatly influenced by the “Capacity/Capital Spending Cycle Model” as the DRAM and NAND flash markets surged and served to drive total IC industry growth of 25%.  It would initially appear that the strong correlation coefficient between worldwide GDP growth and total IC market growth that had been evident from 2010 through 2016 had disappeared in 2017.  However, IC Insights does not believe that is the case.

When excluding the DRAM and NAND flash segments from the IC market in 2017, the remainder of the IC market displayed an 11% increase, which closely correlates to what would be expected given a worldwide GDP increase from 2.4% in 2016 to 3.1% in 2017.  Moreover, the three-point decline in the total IC market growth rate forecast for 2018, when excluding DRAM and NAND flash (from 11% in 2017 to 8% in 2018), is expected to mirror the slight decline expected for worldwide GDP growth this year as compared to last year.  Thus, excluding the amazing surge for the DRAM and NAND flash markets in 2017 and 2018, IC Insights believes that the trend toward an increasingly close correlation between total IC market growth and worldwide GDP growth is still largely intact.
Global GDP Impact on Worldwide IC Market Growth Forecast to Rise

Figure 1

(备注:文章来源于网络,信息仅供参考,不代表本网站观点,如有侵权请联系删除!)

在线留言询价

相关阅读
Revenue Growth in China's Semiconductor Industry Would Slow Down to 16.2% in 2019 due to Pessimistic
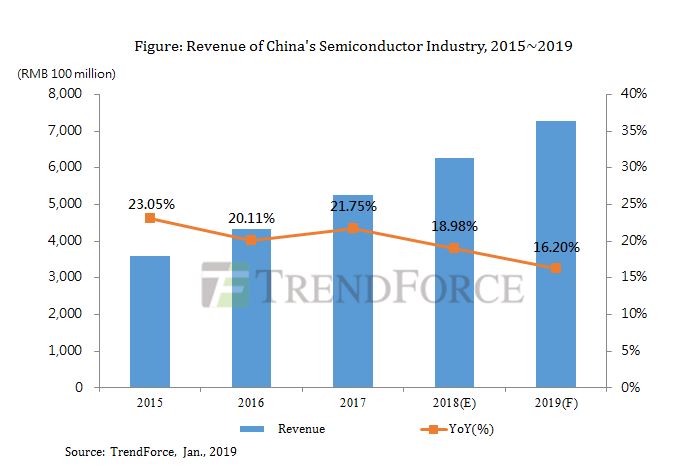
  According to the latest report by TrendForce - Breakdown Analysis of China’s Semiconductor Industry, the outlook for China’s semiconductor industry has been tampered since the second half of 2018 due to pessimistic economy worldwide and uncertainties brought by the China-U.S. trade war, although the industry managed to reach a total revenue of over 600 billion RMB in 2018. Looking ahead to 2019, the revenue of China's semiconductor industry is expected to reach RMB 729.8 billion, but the annual growth rate would slow down to 16.20%, the lowest in the past five years.  According to Jeter Teo, Research Director at TrendForce, there would be several challenges for China's semiconductor industry in the coming year, including the global economic slowdown, the overall weak demand, the negative growth in global smartphone production volume, as well as the continued trade conflicts between China and the United States.  However, as the Chinese government continues to seek self-sufficiency of chips and aims at reducing its dependence on foreign companies, the domestic semiconductor industry will keep growing. On the other hand, new applications will trigger increasing demand for semiconductors, driven by emerging technologies like AI, 5G, autonomous driving, electric vehicles, CIS, biometric recognition, Internet of Things, and edge computing.  It is worth noting that, recent years have seen the rise of China's domestic IC design industry, which has played a key role in leading the development of China's semiconductor industry. The industrial structure has continued to be optimized as well. For 2019, the sector of IC design is expected to account for 40.62% of China's semiconductor industry, while IC manufacturing would account for 28.68%, IC testing and packaging would take about 30.7%.  On the other hand, TrendForce’s data show that key sectors of the semiconductor industry are expected to register continued growth in revenue, with the growth rate of IC manufacturing reaching 18.58%, higher than 17.86% of IC design and 12% of IC testing and packaging. More than 10 new fabs for 12-inch wafer will enter production in China in 2019, while some 8-inch wafer fabs and the power semiconductor sector anticipate production expansion.
2019-01-25 00:00 阅读量:4070
Demand for xEV Batteries Grow Steadily, but Chinese xEV Battery Market Faces Reshuffle as Subsidies Phase Out
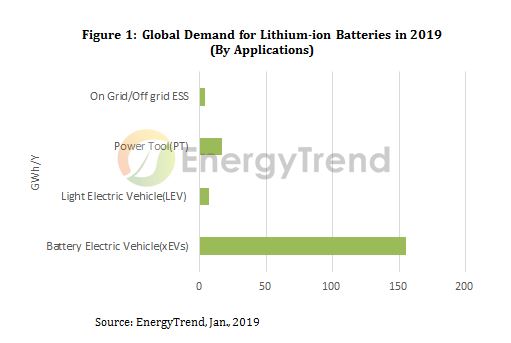
  According to the latest research by EnergyTrend, a division of TrendForce, the market of new energy vehicle will continue to grow steadily, driving the demand for xEV batteries, despite the slowdown in global automotive market since 2018. The global demand for lithium-ion batteries used in new energy passenger cars is estimated to reach 155GWh in 2019, a growth of 63% from 95GWh in 2018.  According to Duff Lu, senior research manager of EnergyTrend, China has become the world's fastest-growing market for new energy vehicles driven by the government’s subsidies and supporting policies. After a rapid growth in 1H18, the shipments of new energy cars in China slowed down in 2H18, moderating the demand in the xEV battery industry as well. However, with increasing penetration of new energy vehicles, the demand for lithium-ion batteries used in new energy passenger cars in China will grow to 54GWh in 2019, a growth of nearly 80% from 30GWh in 2018.  In terms of supply, the production capacity of xEV battery in China has surpassed 134GWh by the end of 2018, and has a chance to reach 164GWh in 2019. Amid the oversupply and phasing out of subsidies from the Chinese government, the industry has been faced with a reshuffle since the second half of 2018. Major manufacturers have grown stronger at the expense of the demise of smaller companies. Leading players like Contemporary Amperex Technology (CATL) and BYD continue to expand, while less competitive ones who rely too much on regional markets, such as OptimumNano Energy, may have to exit the market during the market reshuffle.  EnergyTrend expects that, with new capacity entering operation in 2019, the xEV battery industry will become more concentrated. The top five battery manufacturers would continue to grow and become the major suppliers. Subsidies from the Chinese government will be phased out by 2020, but before that, the industry will still depend on the subsidies to cover their R&D costs for advanced battery technologies. Manufacturers need to continue the development of high energy density solutions, building up competitiveness, before the electric vehicle market enters the maturity stage.
2019-01-25 00:00 阅读量:4468
Semiconductor Unit Shipments Exceeded 1 Trillion Devices in 2018
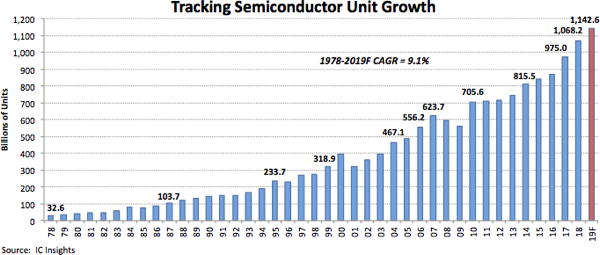
  Semiconductor units forecast to increase 7% in 2019 with IC units rising 8%, O-S-D units growing 7%.  Annual semiconductor unit shipments, including integrated circuits and optoelectronics, sensors, and discrete (O-S-D) devices grew 10% in 2018 and surpassed the one trillion unit mark for the first time, based on data presented in the new, 2019 edition of IC Insights’ McClean Report—A Complete Analysis and Forecast of the Integrated Circuit Industry. As shown in Figure 1, semiconductor unit shipments climbed to 1,068.2 billion units in 2018 and are expected to climb to 1,142.6 billion in 2019, which equates to 7% growth for the year.  Starting in 1978 with 32.6 billion units and going through 2019, the compound annual growth rate for semiconductor units is forecast to be 9.1%, a very impressive growth figure over 40 years, given the cyclical and often volatile nature of the semiconductor industry.Figure 1  Over the span of just four years (2004-2007), semiconductor shipments broke through the 400-, 500-, and 600-billion unit levels before the global financial meltdown caused a big decline in semiconductor unit shipments in 2008 and 2009.  Unit growth rebounded sharply with 25% growth in 2010, which saw semiconductor shipments surpass 700 billion devices. Another strong increase in 2017 (12% growth) lifted semiconductor unit shipments beyond the 900-billion level before the one trillion mark was achieved in 2018.  The largest annual increase in semiconductor unit growth during the timespan shown was 34% in 1984, and the biggest decline was 19% in 2001 following the dot-com bust.  The global financial meltdown and ensuing recession caused semiconductor shipments to fall in both 2008 and 2009; the only time that the industry experienced consecutive years in which unit shipments declined.  The 25% increase in 2010 was the second-highest growth rate across the time span.  The percentage split of total semiconductor shipments is forecast to remain heavily weighted toward O-S-D devices in 2019 (Figure 2).  O-S-D devices are forecast to account for 70% of total semiconductor units compared to 30% for ICs.  This percentage split has remained fairly steady over the years.  In 1980, O-S-D devices accounted for 78% of semiconductor units and ICs represented 22%.  Many of the semiconductor categories forecast to have the strongest unit growth rates in 2019 are those that are essential building-blocks for smartphones, automotive electronics systems, and devices that are used in computing systems essential to artificial intelligence, “big data,” and deep learning applications.Figure 2
2019-01-24 00:00 阅读量:4032
Despite concern, large TFT LCD panel shipments increase
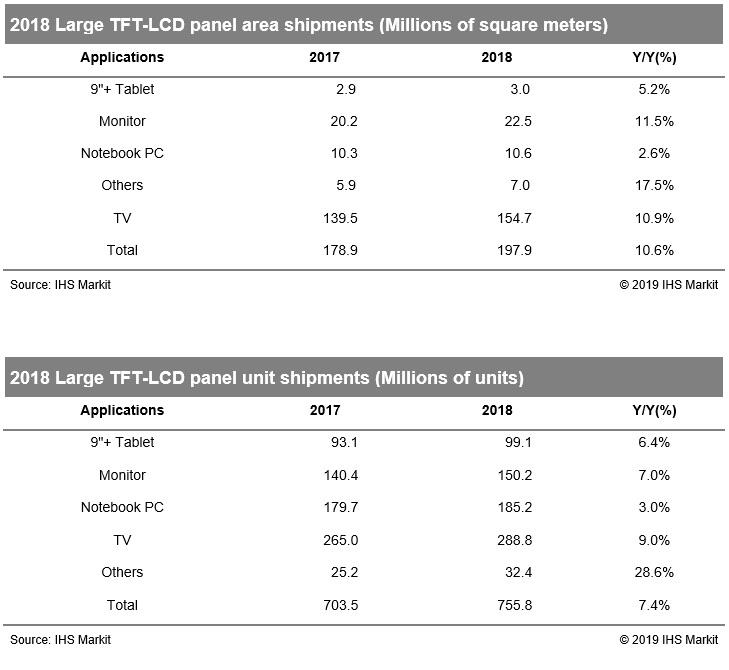
  Global shipments of large thin-film transistor (TFT) liquid crystal display (LCD) panels rose again in 2018 despite concerns of over-supply in the market. In particular, area shipments increased by 10.6 percent to 197.9 million square metres compared to the previous year, driven by TV and monitor panels, according to IHS Markit.  Fierce price competition in large 65 and 75-inch display panels was ignited as Chinese panel maker BOE started the mass production of the panels in 2018 at its B9 10.5-generation facility. “With BOE operating the 10.5-generation line, panel makers have become more aggressive on pricing since early 2018 to digest their capacity,” said Robin Wu, principal analyst at IHS. “Large panels are still more profitable than smaller ones.”  Rising demand for gaming-PC and professional-purpose monitors boosted shipments of high-end, large panels. “Some panel makers have allocated more monitor panels to the fab, replacing existing TV panels, to make up for poor performance of that business,” Wu said.  Demand for other applications, which include public, automotive and industrial displays, recorded the highest growth rates of 17.5 percent by area and 28.6 percent by unit. “Panel makers view these applications as a new cash cow that can compensate for the sharp price erosion in main panels for TVs, monitors and notebook PCs,” Wu said.  LG Display led the area shipments of large display panels, with a 21 percent share in 2018, followed by BOE (17 percent) and Samsung Display (16 percent). BOE boasted the largest unit-shipment share of 23 percent, followed by LG Display (20 percent) and Innolux (17 percent), according to the Large Area Display Market Tracker by IHS Markit.  Large TFT LCD panel shipment growth is expected to continue in 2019. The preliminary forecast for unit shipments of three major products indicates that panel makers will continue to focus on the monitor and notebook PC panel businesses, increasing shipments by 5.3 percent and 6.6 percent, respectively, over the year, while shipments of TV panels are forecast to grow just 2.6 percent.  In 2019, three new 10.5-generation fabs – ChinaStar’s T6, BOE’s second fab and Foxconn/Sharp’s Guangzhou line – are expected to start mass production. All of them are assigned to manufacture TV panels, further boosting TV panel supply. “As the TV panel business is predicted to remain tough, panel makers, who enjoyed relatively better outcomes with monitor and notebook PC panels in 2018, will likely focus on the IT panel businesses,” Wu said.
2019-01-24 00:00 阅读量:1791
  • 一周热料
  • 紧缺物料秒杀
型号 品牌 询价
MC33074DR2G onsemi
RB751G-40T2R ROHM Semiconductor
BD71847AMWV-E2 ROHM Semiconductor
CDZVT2R20B ROHM Semiconductor
TL431ACLPR Texas Instruments
型号 品牌 抢购
BU33JA2MNVX-CTL ROHM Semiconductor
BP3621 ROHM Semiconductor
STM32F429IGT6 STMicroelectronics
TPS63050YFFR Texas Instruments
ESR03EZPJ151 ROHM Semiconductor
IPZ40N04S5L4R8ATMA1 Infineon Technologies
热门标签
ROHM
Aavid
Averlogic
开发板
SUSUMU
NXP
PCB
传感器
半导体
相关百科
关于我们
AMEYA360微信服务号 AMEYA360微信服务号
AMEYA360商城(www.ameya360.com)上线于2011年,现 有超过3500家优质供应商,收录600万种产品型号数据,100 多万种元器件库存可供选购,产品覆盖MCU+存储器+电源芯 片+IGBT+MOS管+运放+射频蓝牙+传感器+电阻电容电感+ 连接器等多个领域,平台主营业务涵盖电子元器件现货销售、 BOM配单及提供产品配套资料等,为广大客户提供一站式购 销服务。